For the visualization and modeling of
volumetric maps in concert with docked structures we recommend the free
graphics
programs VMD, UCSF Chimera or Sculptor, which
support map formats used by Situs. Most graphics
programs that can render structures in PDB format together with 3D
density maps is suitable for Situs. Historically, VMD was used for the
Situs tutorials - and is still widely featured in this web
documentation - but we will point to advantages of UCSF Chimera or Sculptor
as is appropriate.
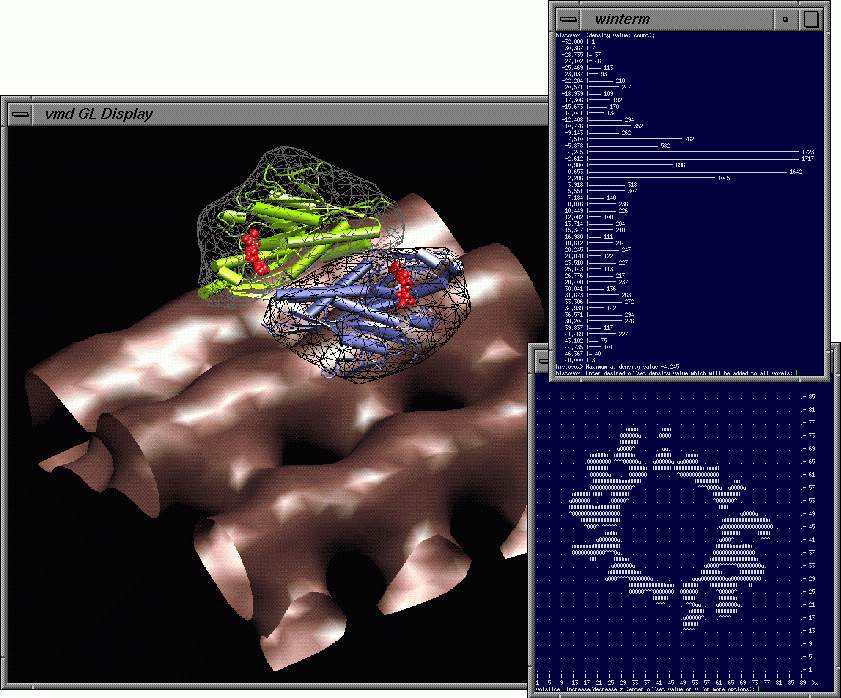
In addition to
these graphics programs, Situs also provides analysis and rendering
capabilities in the terminal window. The following figure shows three
typical analysis and
graphics utilities used in the Situs workflow: